How we calculate: where vitaloop's nutrient data comes from
Published · Vitaloop Labs
When vitaloop tells you how much iron or vitamin C you have had today, that number comes from somewhere specific. This article explains which food composition tables the data comes from, how much of it was measured in a laboratory, which reference values it is compared with, and what to keep in mind when you read it. Figures as of 21 October 2026.
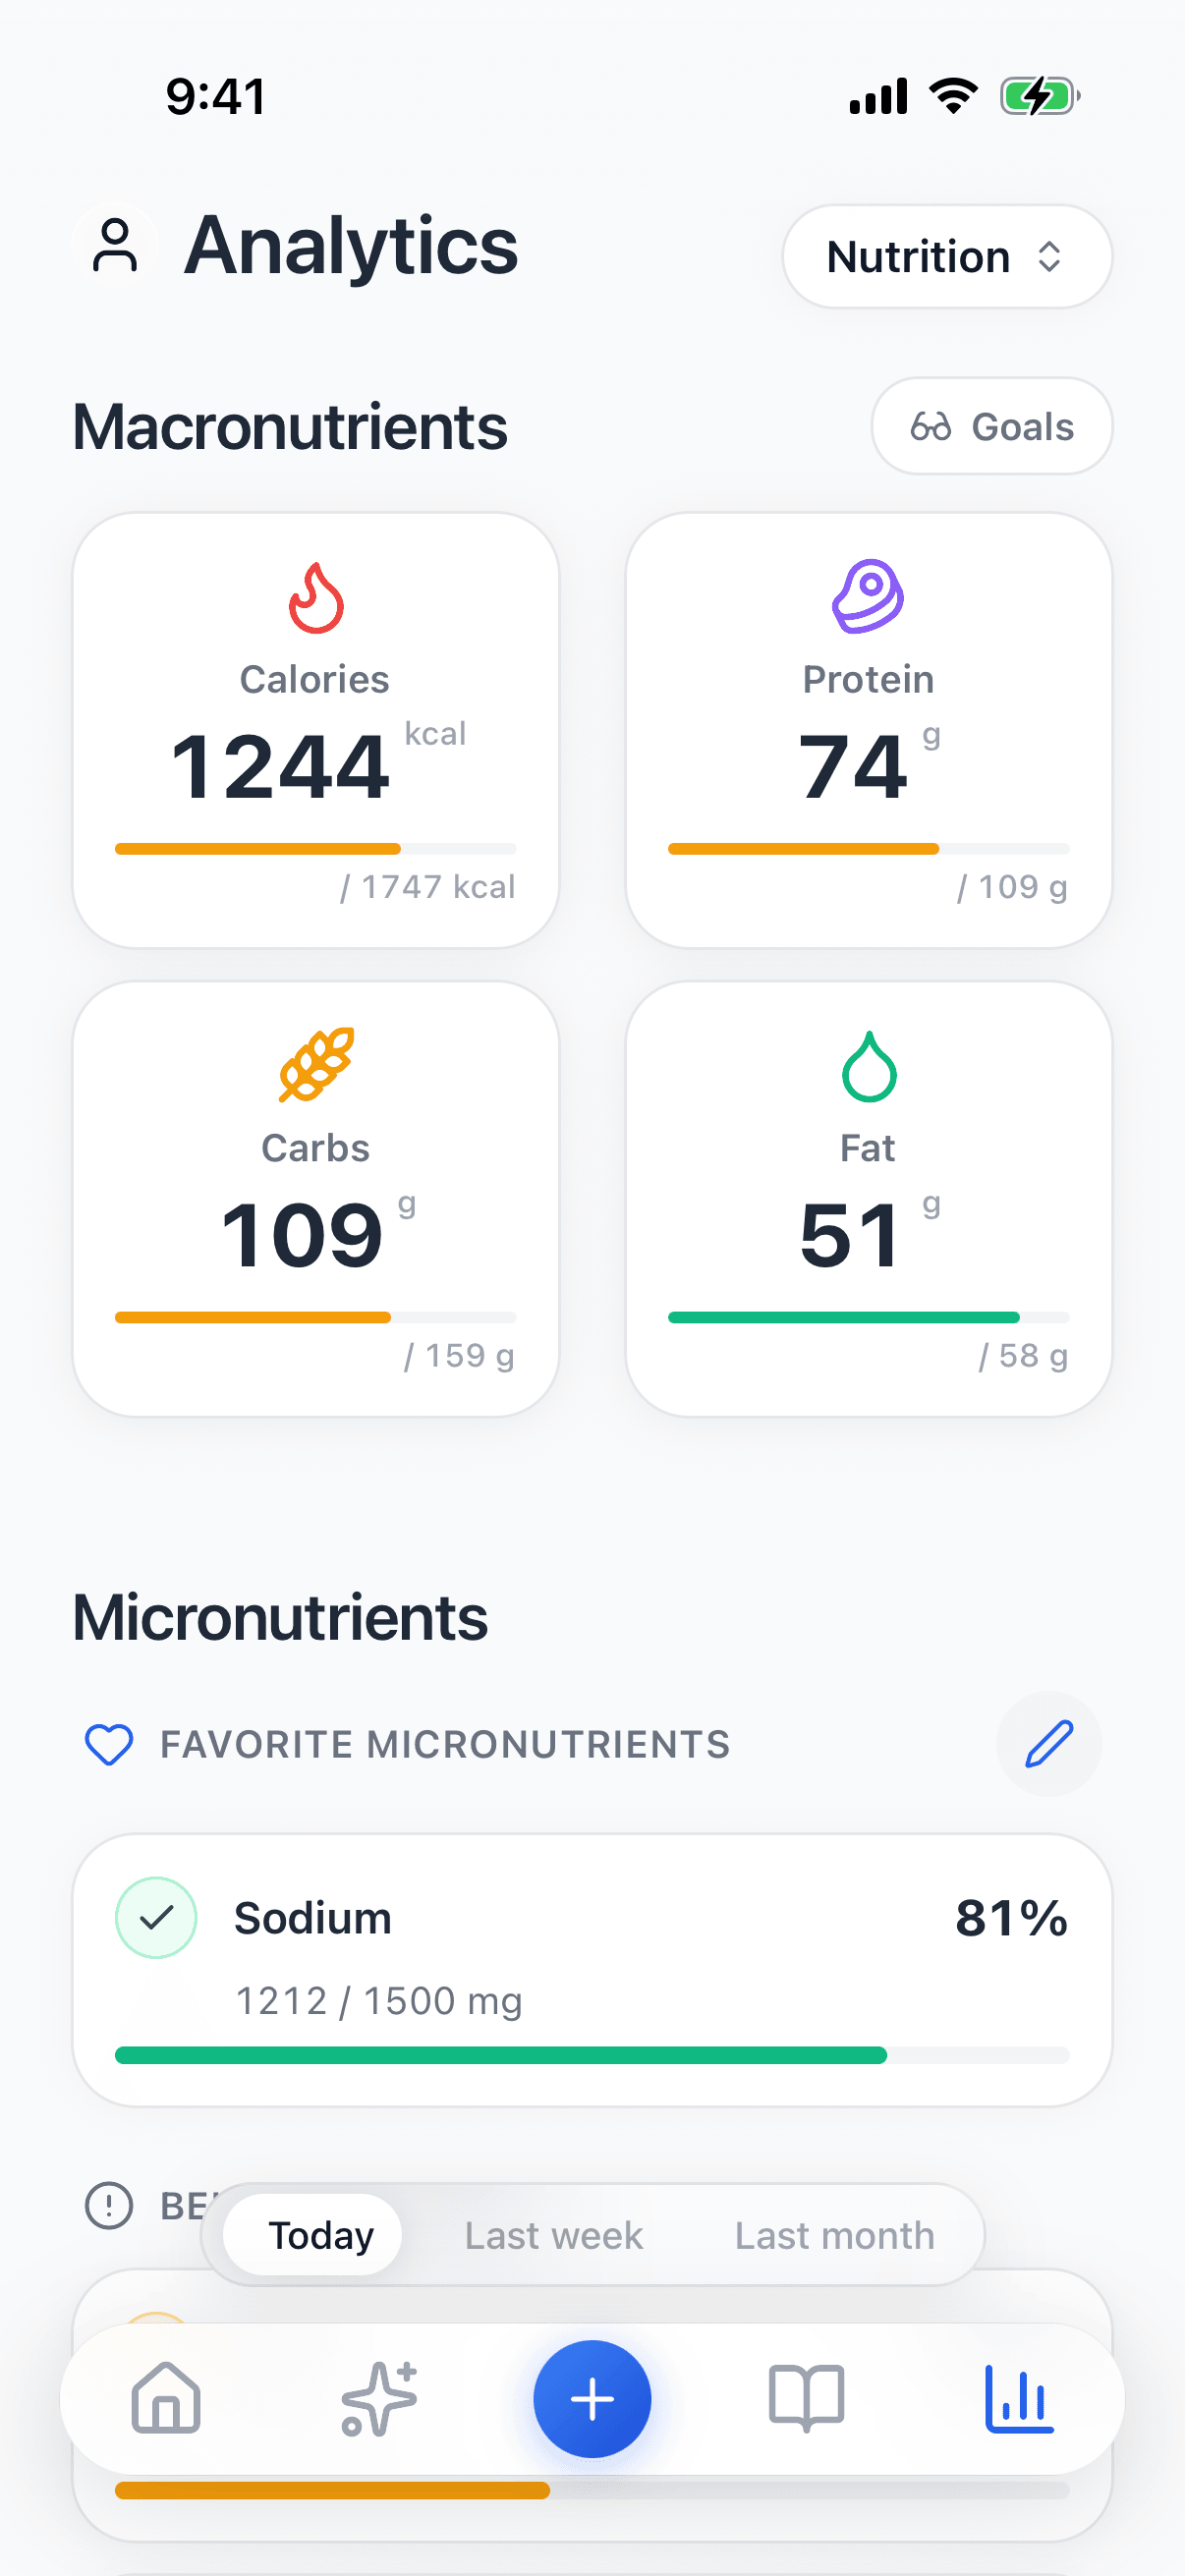
vitaloop is free, with no ads. Without paying, you log food, drinks and supplements and see the calories, macronutrients and micronutrients of every food; on the Analytics dashboard you follow 5 micronutrients at a time and swap them whenever you like. Pro (9.90 € a month or 49.90 € a year) adds the AI assistant: logging by photo, voice or text, the weekly report, patterns, and estimated micronutrients for packaged products. The data described here is the same on both plans.
Where the data comes from
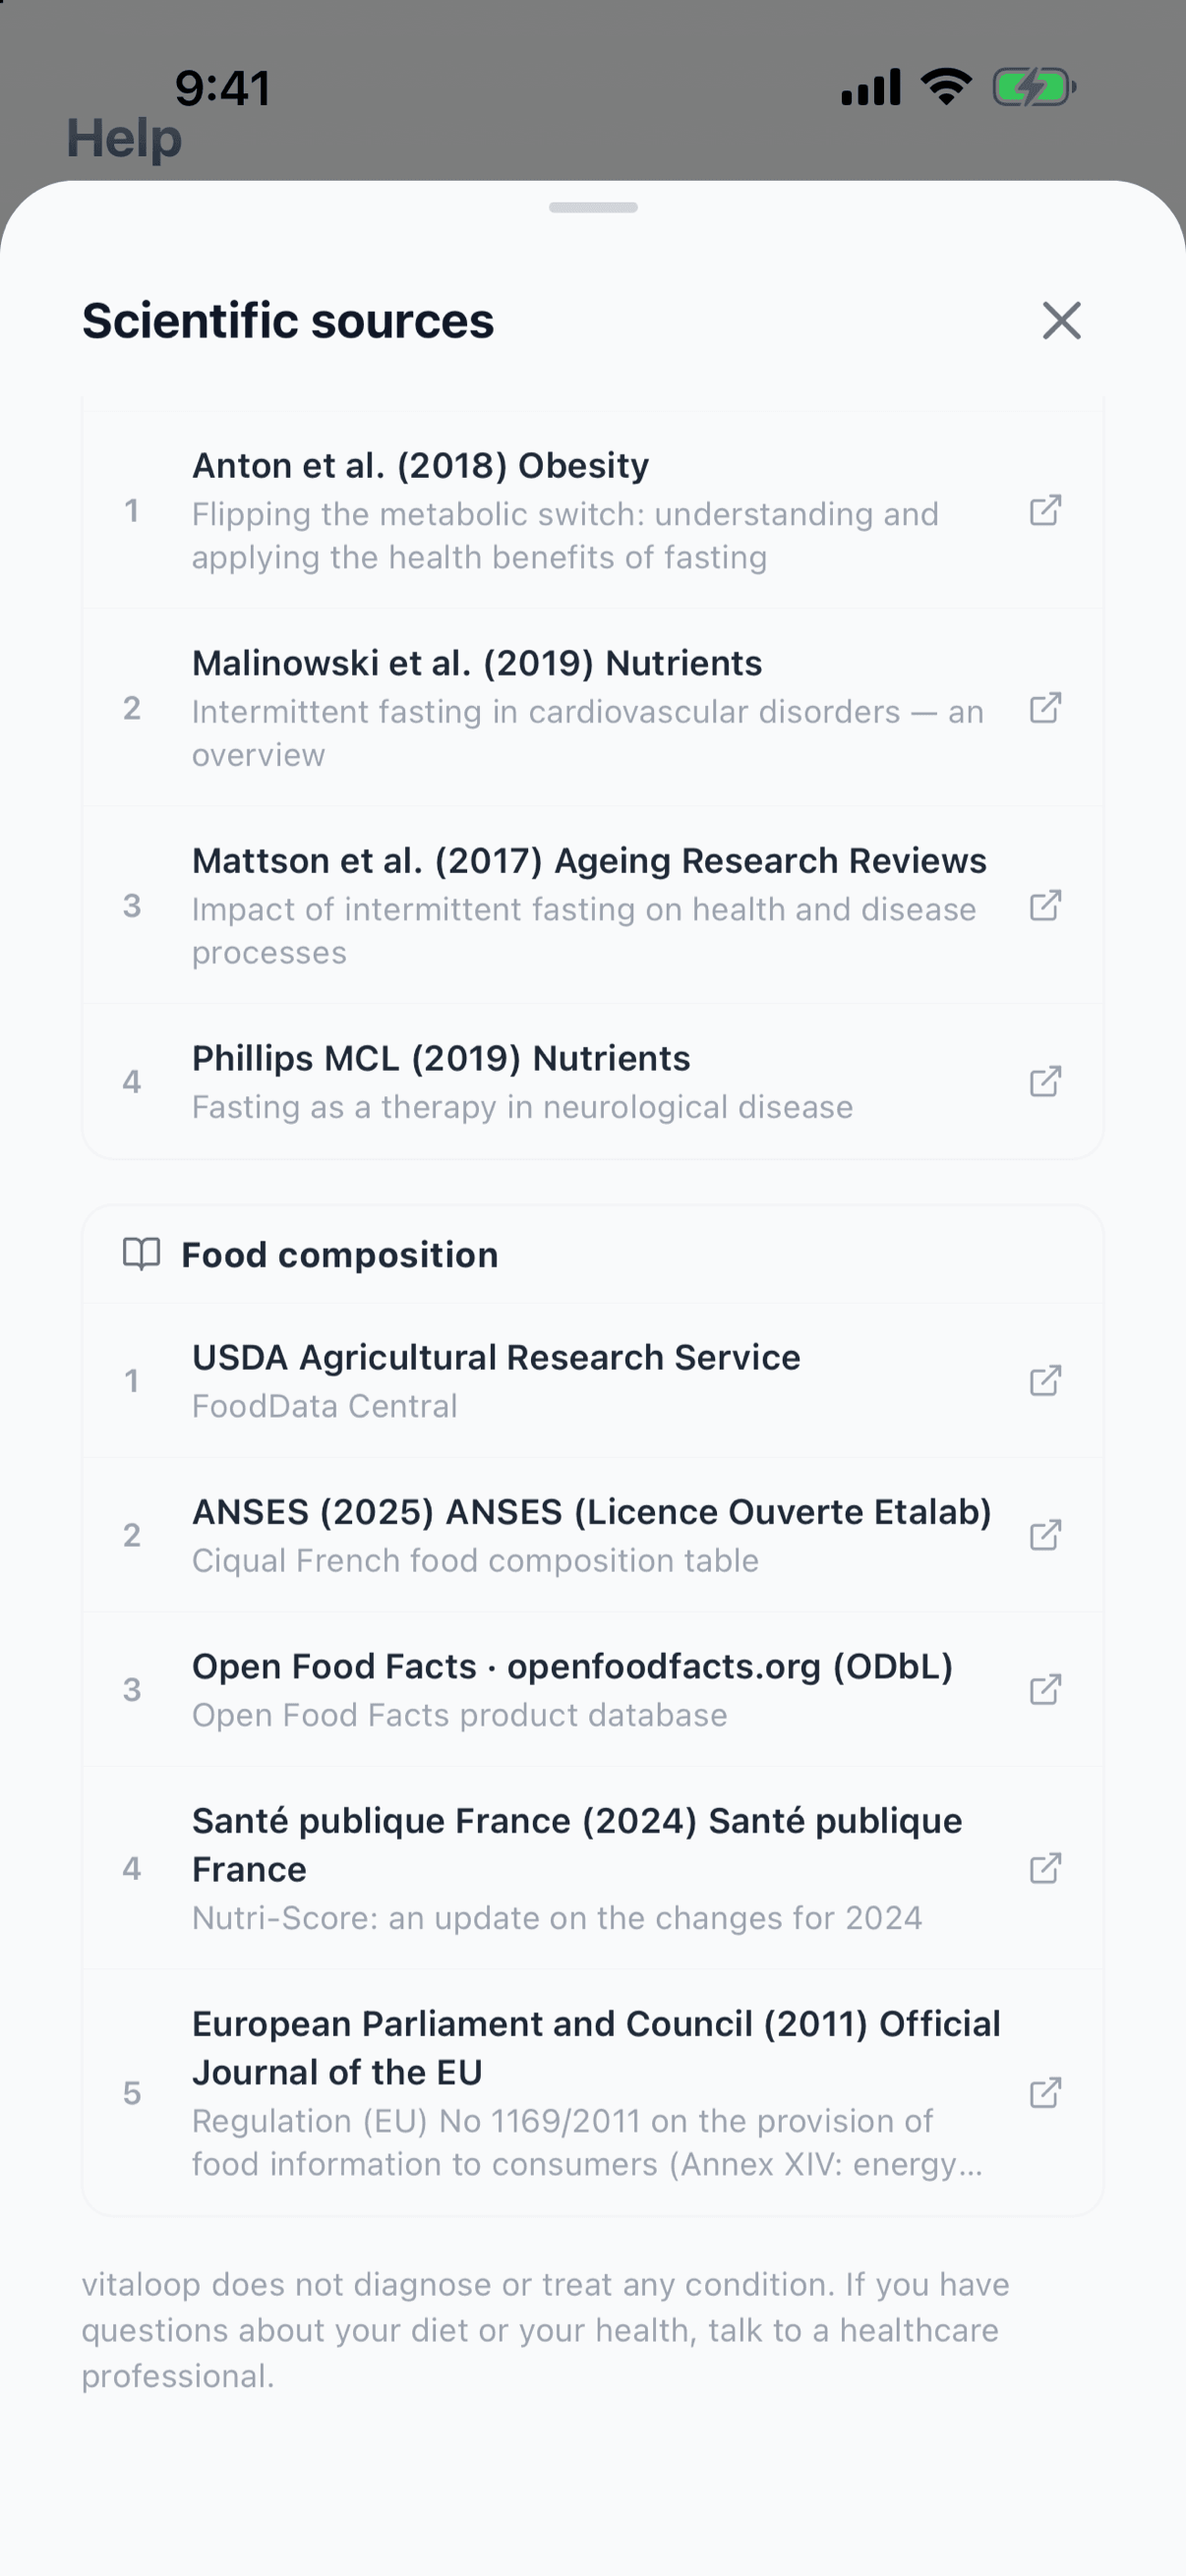
- USDA FoodData Central, from the United States Department of Agriculture: 88% of the foods. We draw on three of its datasets: FNDDS 2021–2023, which describes foods as eaten; SR Legacy, in its final 2018 release; and Foundation Foods, in its April 2026 release.
- ANSES-CIQUAL, the table of the French food safety agency, 2025 edition: 9% of the foods, mainly ones USDA does not cover.
- Calculated by vitaloop: 3%, such as a cooked food worked out from its raw form, or a sauce built from ingredients in the tables above.
- Open Food Facts, the collaborative database of packaged products: when you scan a barcode, the name, ingredients and label values come from there. The percentages above do not include these products.
Every food has a name in English, Spanish and Catalan. In the app, the sources are under Profile → Help → Scientific sources, each with a link.
How much of each value was measured
For every nutrient in every food, we know where the number comes from. As of 21 October 2026:
- Measured: 77%. Published by the source from laboratory analysis.
- Calculated: 12%. Derived from measured values: a cooked food from its raw form, a dish from its recipe, or a total such as omega-3 from its parts.
- Estimated by the source itself: 10%.Values that USDA or CIQUAL flag as not analysed, for example a nutrient USDA assumes to be zero, or one CIQUAL reports as "traces".
- Composite dishes without a single source record: under 1%.
None of these values is vitaloop's own estimate: all of them come from the source or are calculated from it. And when a source publishes no value for a nutrient in a food, we leave it blank rather than show a zero, which would suggest the food contains none.
The 42 values for each food, and why these
- Energy and macronutrients (6): calories, protein, carbohydrate, fat, fibre and sugars, as on an EU label.
- Fat quality (7): saturated, monounsaturated and polyunsaturated fat, cholesterol, omega-3, EPA + DHA and omega-6. EPA + DHA is shown separately because EFSA gives it its own reference (250 mg a day), which would be lost inside the omega-3 total.
- 13 vitamins: A, D, E, K, C, B1, B2, B3, B5, B6, B7 (biotin), B9 (folate) and B12.
- 13 minerals: calcium, phosphorus, magnesium, sodium, potassium, iron, zinc, copper, selenium, iodine, manganese, chromium and molybdenum.
- Water, alcohol and caffeine (3), which come mostly from what you drink: vitaloop logs drinks the same way as food.
All 26 vitamins and minerals have a published reference value for adults, so you can see whether you reach each one. We are working to expand this panel; amino acids, individual sugars and specific fatty acids are next.
The reference values we compare you with
27 values have a personal target based on your age and sex: the 26 vitamins and minerals, plus caffeine. For thiamin and niacin, the target also depends on your energy requirement.
- 23 of 26 follow EFSA's dietary reference values (European Food Safety Authority).
- Sodium and zincfollow the target of the US Institute of Medicine (IOM), with EFSA's upper limit.
- Chromium follows the IOM value, because EFSA has not set one.
- Omega-3, EPA + DHA and omega-6follow EFSA's adequate intakes for fats.
- Caffeine has no target: we show the 400 mg a day limit the FDA gives for adults, which is not a dietary reference value.
The app names the authority behind each figure. If your dietitian sets you a different target, you can change it.
Carbohydrate, counted as on an EU label
In the EU, the carbohydrate on a label excludes fibre, which is declared separately and provides 2 kcal per gram (Regulation (EU) 1169/2011, Annexes I and XIV). In the US, fibre is part of the total (21 CFR 101.9), and that is how USDA publishes its data. In vitaloop every food follows the EU convention, including those from USDA, so the carbohydrate in the app matches the pack.
Packaged products
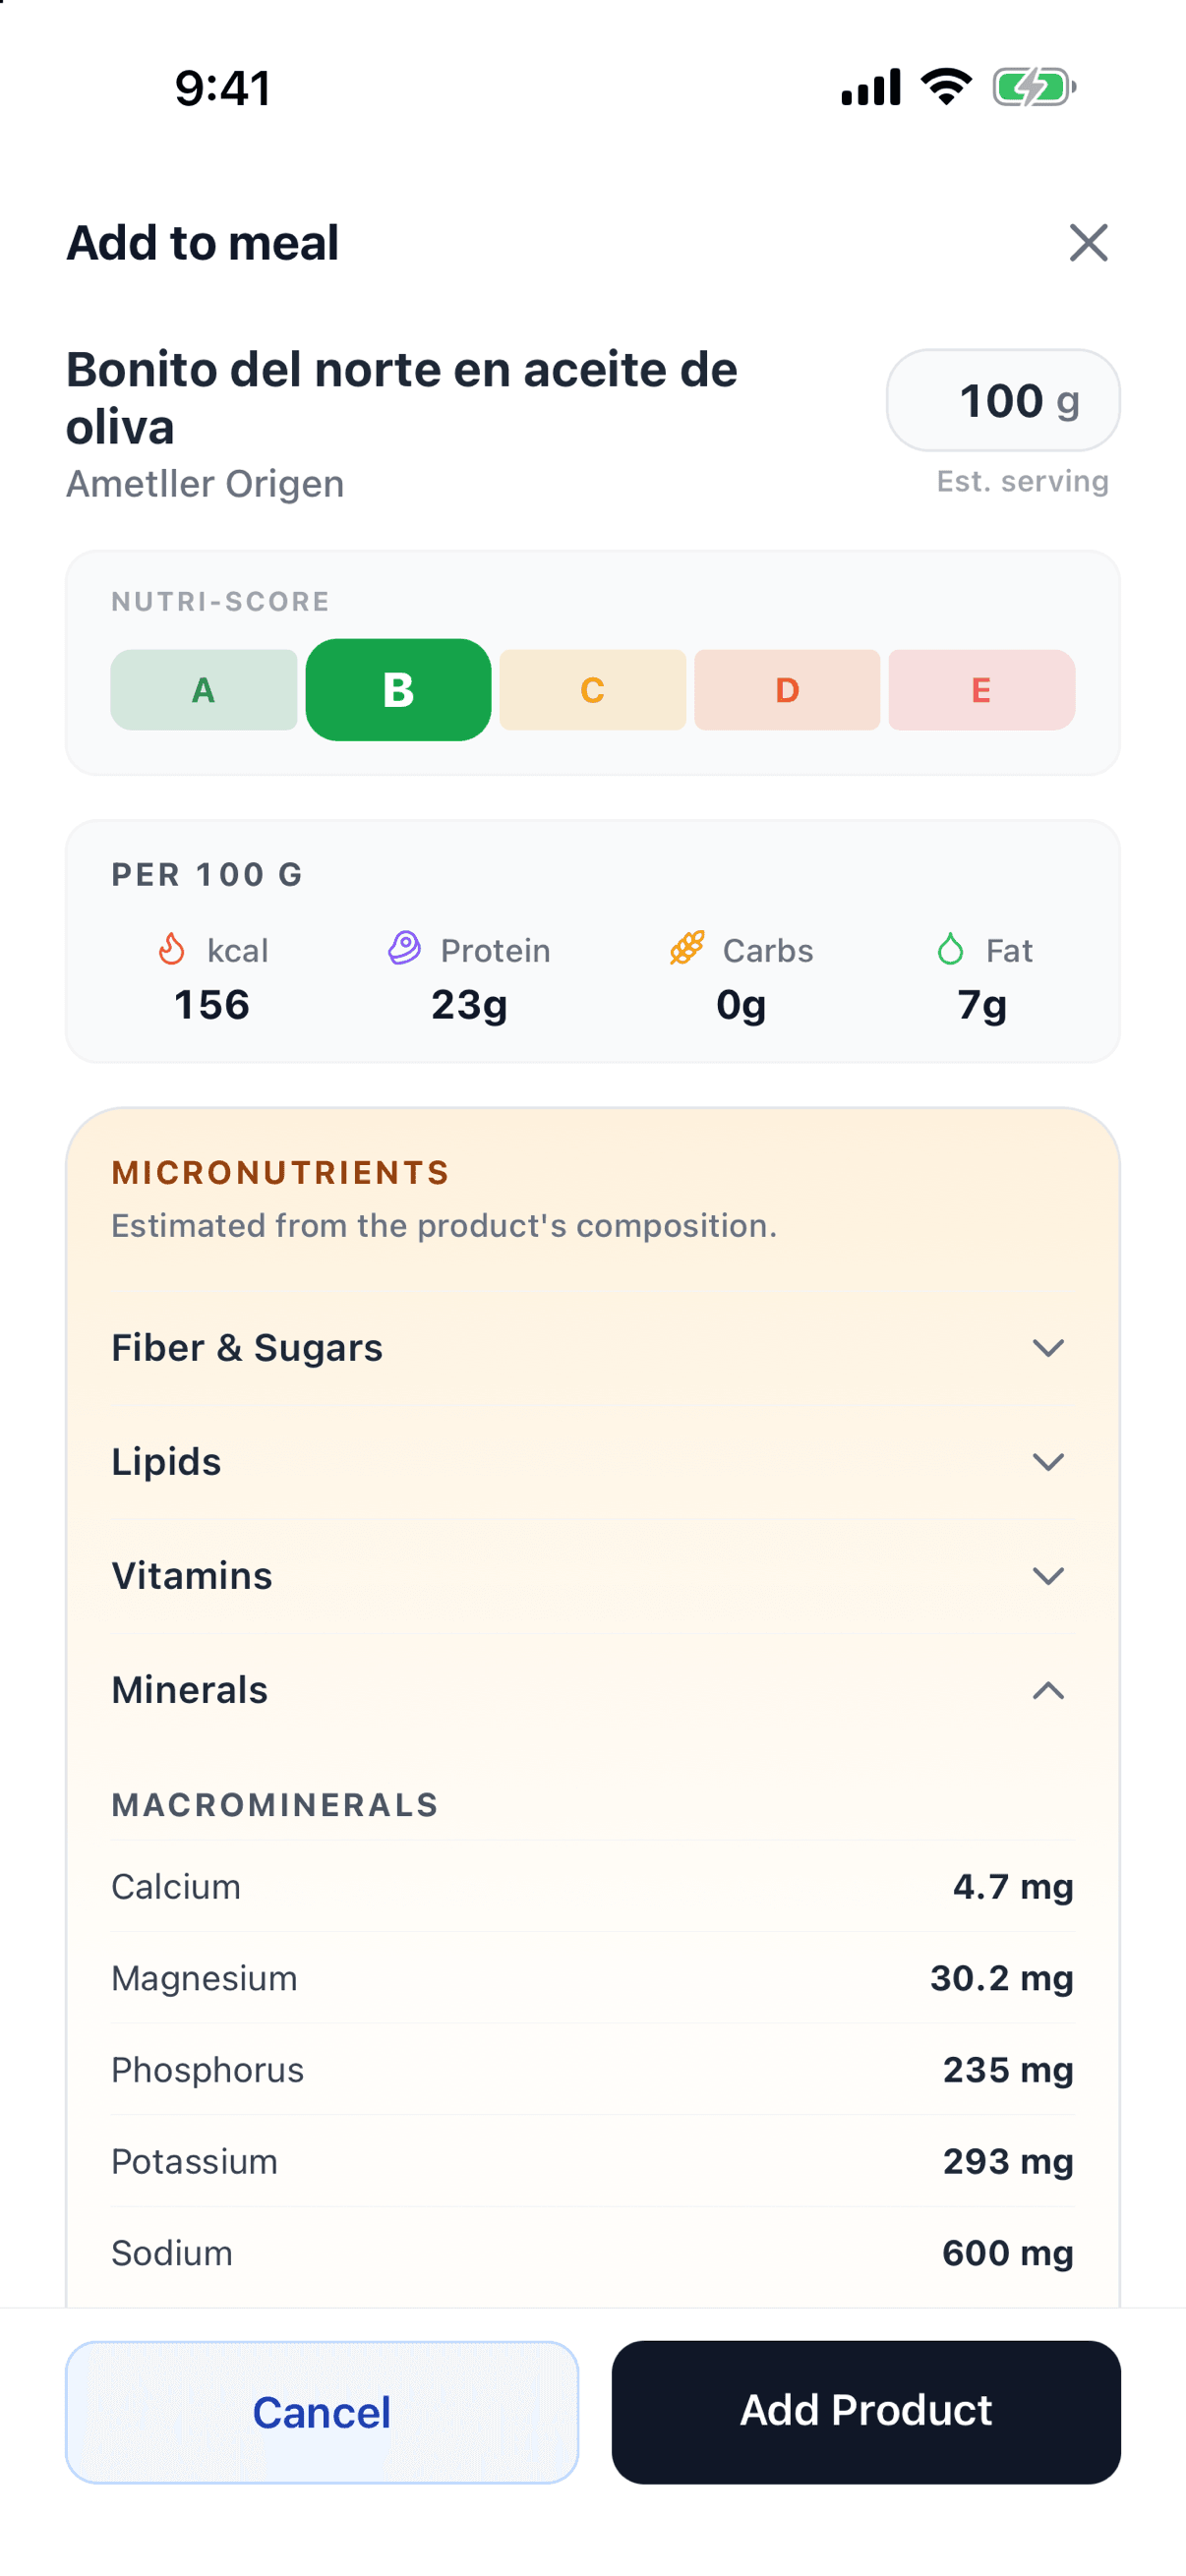
EU labels only have to declare seven values: energy, fat, saturates, carbohydrate, sugars, protein and salt (see why the label only shows 7 nutrients). When you scan a product, every plan shows you what its label says.
With Pro, vitaloop adds the vitamins and minerals the label does not declare, estimated from the product's composition and marked as estimates. If a value cannot be estimated reliably, it is not shown. More in what vitamins and minerals are in a scanned product.
What to keep in mind when reading the data
- A table gives an average. Each value summarises the samples the source analysed. The tomato on your plate may hold more or less vitamin C depending on variety, season and how long it has been in the fridge.
- Labels have a margin.In many cases EU rules allow a product's real value to be up to 20% away from the declared one (European Commission guidance on tolerances, 2012), and Open Food Facts data is contributed by its community. If something looks off, check the pack.
- The vitamin D in your food is only part of it. For many people, most is made in the skin from sunlight, which no food log can measure. The figure you see is a floor, and the app reminds you of this when you open its detail (more in vitamin D in autumn and winter).
- Six nutrients come mostly from supplements. Composition tables publish few values for biotin, pantothenic acid, iodine, chromium, molybdenum and manganese, so the amount from food tends to read low. If you take a supplement that contains them, log it and you will see it counted.
- An estimate is not an analysis. The estimated micronutrients of a packaged product do not replace a laboratory analysis of it, which is why they are marked.
Updates and corrections
We review these figures when the sources or the app's data change, and the article's update date reflects it. If you find a value that does not match its source, write to support@vitaloopapp.com with the name of the food.
Sources
- U.S. Department of Agriculture, Agricultural Research Service. FoodData Central: FNDDS 2021–2023 (2024), SR Legacy (2018), Foundation Foods (2026). Public domain.
- Anses. 2025. Ciqual French food composition table. Licence Ouverte / Etalab 2.0. Values converted to vitaloop's units.
- Open Food Facts product database. ODbL.
- EFSA. Dietary Reference Values for the EU.
- Regulation (EU) No 1169/2011 on the provision of food information to consumers.
vitaloop is a personal nutrition and data-logging app developed by Vitaloop Labs, SL. It is not a medical device as defined under EU Regulation 2017/745 (EU MDR) and does not constitute professional medical advice. Personalized suggestions are based on your personal data and should not be used as a substitute for advice from a qualified healthcare professional. Nutritional data may contain inaccuracies; always verify critical information on product labels.

